

Thermal Mapping in Coffee Roasting: A Complete Guide
Table of Contents
- What Is Thermal Mapping in Coffee Roasting
- Heat Transfer and Roast Curves: The Foundation
- Bean Temperature vs. Environmental Temperature: Why Both Matter
- The Maillard Reaction and Chemical Changes During the Roast
- Sensory Cues and Degree of Roast: Reading the Bean
- Coffee Roasting Roast Profile Software and Data Logging Tools
- Precision Roasting for Complex Sweetness and Flavor Development
- Conclusion
Last Updated: August 16, 2026
What Is Thermal Mapping in Coffee Roasting
Thermal mapping in coffee roasting is the systematic process of monitoring and recording temperature data across multiple points within the roasting drum to create a detailed profile of heat distribution and bean temperature changes throughout the roast cycle. This eliminates guesswork that leads to bitterness and inconsistent flavor by giving roasters precise visibility into what's happening inside the drum at every moment.
Bitterness comes from uneven roasting. When some beans overheat while others lag behind, harsh, burnt notes mask the complex sweetness specialty coffee should deliver. Thermal mapping shows exactly where temperature variations occur and how to adjust airflow, drum speed, and heat input to eliminate them.
The Core Purpose: Eliminating Bitterness Through Temperature Control
Most roasters rely on visual cues alone, watching color, listening for first crack, smelling the roast, but these methods have serious limitations. A bean that looks medium brown might be overcooked inside. First crack occurs at different temperatures depending on bean density, origin, and moisture content. By the time you smell trouble, you've already damaged half the batch.
Thermal mapping flips this approach. Instead of reacting to what you see, you respond to what the data tells you. You know the exact moment bean temperature reaches the Maillard reaction threshold and catch thermal pulsing before it ruins the batch. At Iron Spur Coffee, we use thermal mapping as the foundation of our small-batch roasting process. Every roast is logged, tracked, and refined based on precise temperature data, which is why our beans taste clean and complex rather than harsh and one-dimensional.
How Thermal Mapping Differs From Traditional Roasting
Traditional roasting is reactive. You apply heat, watch color, listen for sounds, and adjust based on instinct. Thermal mapping is proactive. You establish a target roast profile before starting, a predetermined curve showing exactly how bean temperature should climb from start to finish, then monitor whether the actual roast matches that profile. When it deviates, you know immediately and why.
A roaster using thermal mapping can roast five different origins in the same day and produce consistent results from each. A roaster relying on color and sound will struggle to replicate yesterday's batch today.
Heat Transfer and Roast Curves: The Foundation
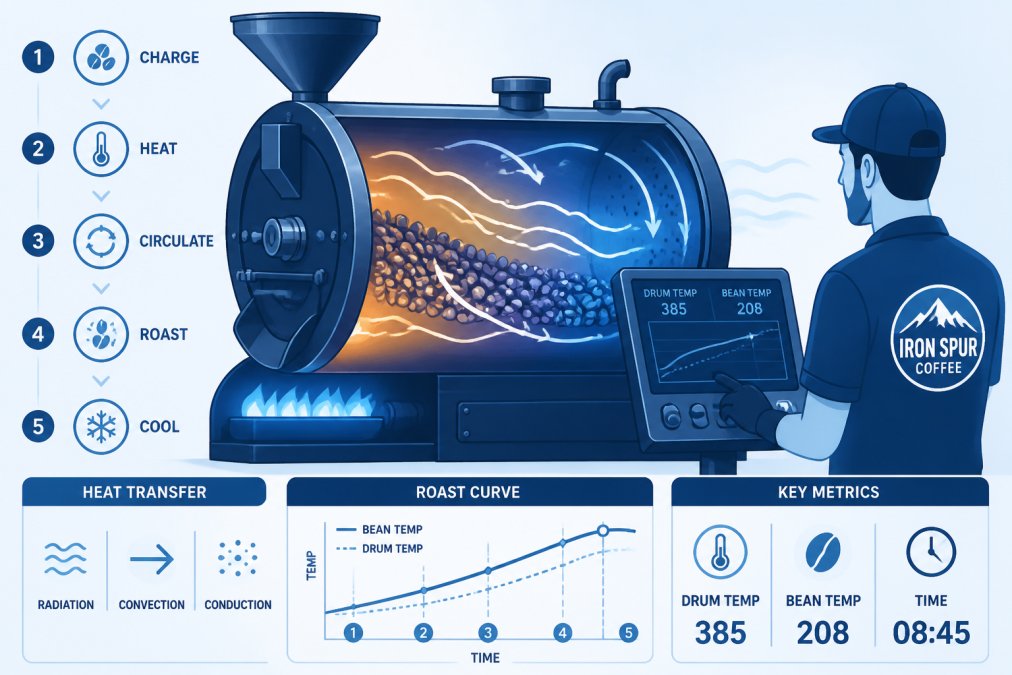
Heat enters the roasting drum through three mechanisms, conduction, convection, and radiation, each behaving differently depending on drum temperature, bean size, airflow, and moisture content. The roast curve visualizes how these forces combine to move bean temperature from ambient to first crack to development to final drop.
Conduction, Convection, and Radiation in the Roasting Drum
Conduction is direct contact heat transfer. Beans touching the drum wall absorb heat directly from the metal. Roasters manage this by adjusting drum speed to keep beans moving and prevent hot spots.
Convection is heat transfer through moving air. Hot air circulates through the drum, heating beans from all sides. Airflow rate directly controls convection intensity; more air means faster heat transfer but also more chaotic bean movement.
Radiation is electromagnetic heat from the drum walls and heating elements. It contributes to overall heat input alongside conduction and convection.
The roast curve shows how these mechanisms combine over time. In the drying phase, beans lose surface moisture and temperature rises slowly. In the browning phase, the Maillard reaction accelerates and temperature rises faster. In the final phase, exothermic reactions dominate and temperature can spike dangerously if heat input isn't reduced.
Reading and Designing a Roast Profile
A roast profile is a graph with time on the x-axis and temperature on the y-axis, showing target bean temperature at each second of the roast. A well-designed profile includes:
- Charge temperature: The drum temperature when beans enter (typically 350-400°F)
- Rate of rise during drying: Usually 8-12°F per minute
- Rate of rise during browning: Typically 10-15°F per minute
- First crack timing: Usually 385-400°F depending on bean density
- Development time: Duration after first crack (typically 1-2 minutes)
- Final temperature: Where you drop the beans (typically 400-430°F)
Roasters design profiles based on the bean's thermophysical properties, density, size, and moisture content. By logging and comparing profiles across origins, roasters build a library of proven curves and predict what a new bean will need.
Bean Temperature vs. Environmental Temperature: Why Both Matter
Most roasters only measure environmental temperature (ET), the air temperature inside the drum. But beans don't roast at air temperature. They roast at their own temperature, which lags behind ET because heat takes time to conduct into the bean's center.
Understanding the Gap Between BT and ET
Bean temperature (BT) is measured with a probe inserted into the bean mass or touching the drum wall. It represents the actual temperature of the coffee itself.
Environmental temperature (ET) is measured with a separate probe in the air space of the drum. It represents the air temperature surrounding the beans.
Early in the roast, ET is significantly higher than BT. As the roast progresses and beans warm up, the gap narrows. By first crack, BT and ET might be only 20-30°F apart. This matters because roast decisions should be based on BT, not ET. If you're targeting first crack at 400°F BT and only watching ET, you might drop the beans when ET reaches 430°F, but BT might only be 380°F, meaning you've under-roasted. Thermal mapping captures both temperatures simultaneously, showing exactly how heat is penetrating the beans.
Rate of Rise in Coffee Roasting and Precision Control
Rate of rise (RoR) is how fast bean temperature is climbing at any given moment, measured in degrees per minute. It's one of the most important variables in thermal mapping because it directly predicts what will happen next.
Early in the roast, RoR is typically 8-12°F per minute. As the Maillard reaction kicks in around 300°F, RoR accelerates to 12-15°F per minute. Around 350°F, RoR can spike to 20°F per minute or higher, dangerous because it leads to thermal pulsing and bitter compounds. A skilled thermal mapping system shows RoR in real time, allowing you to adjust heat input before it becomes a problem. Many roasters aim to keep RoR steady or slightly declining as they approach first crack.
The Maillard Reaction and Chemical Changes During the Roast
The Maillard reaction is a chemical process where amino acids and reducing sugars interact under heat to create hundreds of new compounds that give roasted coffee its complexity, sweetness, and aroma. But this reaction also creates bitter compounds if allowed to run too hot or too long.
Endothermic and Exothermic Phases
The roast has two distinct thermal phases.
Endothermic phase (drying and early browning): The beans are absorbing heat from the environment. They're losing moisture and starting the Maillard reaction. Bean temperature lags behind environmental temperature. You need consistent heat to keep the roast moving. If you reduce heat too much, the roast stalls and you get baked, flat flavors.
Exothermic phase (late browning and development): The Maillard reaction is running so fast that the beans are generating their own heat. Bean temperature can rise faster than environmental temperature. This is where thermal pulsing happens, sudden spikes that create harsh, bitter compounds. You need to reduce heat input or increase airflow to prevent runaway temperature. Thermal mapping shows this transition clearly around 350-370°F, signaling when to reduce heat input by 20-30% to keep RoR under control.
Discover Iron Spur Coffee Today →
First Crack, Second Crack, and Development Time
First crack is when cell walls rupture from internal pressure, happening around 385-410°F depending on bean density and moisture. First crack marks the end of browning and the beginning of development.
Development time is the duration after first crack where flavor compounds continue to mature. Most specialty coffee is dropped 1-2 minutes after first crack. Drop too early and the coffee tastes grassy and underdeveloped. Drop too late and you get bitter, charred notes. Thermal mapping lets you nail this timing precisely instead of guessing based on sound.
Sensory Cues and Degree of Roast: Reading the Bean
Even with thermal mapping, you still need to understand what the beans are telling you visually and aromatically. Thermal data is objective, but flavor development is subjective. The best roasters combine both.
Visual Mapping vs. Data Mapping
Visual mapping means watching bean color as a proxy for roast level. Light roasts are cinnamon brown, medium roasts are chocolate brown, dark roasts are nearly black. This works as a rough guide, but it's unreliable because bean size, origin, and moisture content all affect how quickly color develops.
Data mapping means using thermal data to define roast level. A light roast is "dropped at 400°F BT, 60 seconds after first crack." This is precise and repeatable. The best approach combines both: use thermal data to define your target profile, roast to that profile, and verify the result by looking at the beans and tasting the cup.
Moisture Loss and Thermophysical Properties
Beans lose about 15-18% of their weight during roasting, mostly water but also some volatile compounds. This moisture loss is critical to flavor development. Beans that don't lose enough moisture taste grassy and underdeveloped. Beans that lose too much taste thin and burnt.
Thermophysical properties describes how the bean responds to heat based on its density, size, and composition. A high-altitude bean from Kenya has different thermophysical properties than a sea-level bean from Sumatra. Thermal mapping reveals these differences, allowing you to design a profile that suits that specific bean's characteristics.
Coffee Roasting Roast Profile Software and Data Logging Tools
Raw temperature data is only useful if you can visualize it, analyze it, and use it to make roasting decisions. That's what roast profile software does.
Real-Time Monitoring and Software Integration
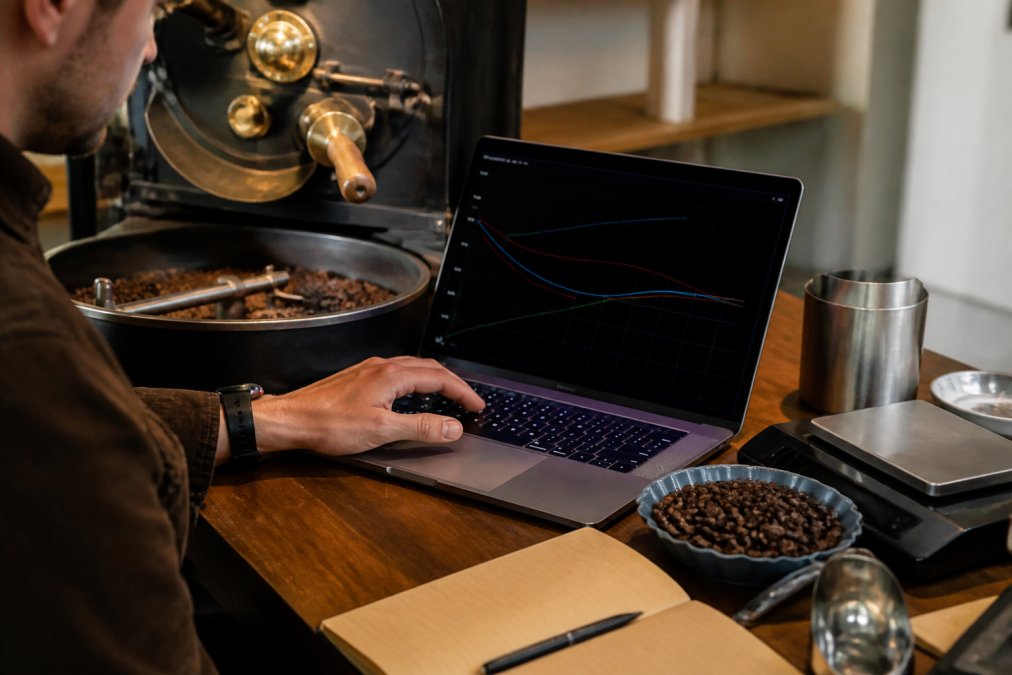
Modern roast profile software displays bean temperature, environmental temperature, and rate of rise on a graph in real time. You see a line climbing toward your target profile. If it deviates, too fast, too slow, you see it immediately and can adjust. Some systems include automated alarms: "RoR is rising above target, reduce heat input" or "You're approaching first crack, prepare to drop."
Integration with roasting equipment is key. The best systems connect directly to the roaster's burner and airflow controls, automatically adjusting heat and airflow to keep the roast on track. This removes human error and improves consistency dramatically. At Iron Spur Coffee, we use precision roast profile software integrated with our drum roaster. Every roast is logged with full thermal data: BT, ET, RoR, duration, bean origin, batch size, and ambient conditions. This creates a searchable database of roasts that lets us pull up old profiles and adjust them slightly for any variables.
Thermal Mapping Troubleshooting and Consistency Across Batches
Thermal mapping data helps you diagnose roasting problems. If one batch has a much slower RoR than your target profile, you know to increase heat input or check for bean clumping. If RoR is spiking dangerously, you know to reduce heat or increase airflow.
Consistency across batches comes from logging every roast and comparing profiles. If batch A tastes better than batch B, you compare their thermal data to identify which variables produced superior flavor. By identifying these patterns, you can predict which thermal profile will produce the best flavor and repeat it reliably.
Precision Roasting for Complex Sweetness and Flavor Development
When you use thermal mapping correctly, coffee tastes fundamentally different. You get clean, complex sweetness instead of harsh bitterness and consistent flavor from bag to bag.
Precision roasting means controlling every variable that affects flavor: heat input, airflow, bean mass, roast duration, and development time. Complex sweetness develops during the Maillard reaction when amino acids and sugars create hundreds of new compounds. But this reaction is delicate. Too much heat and you get bitter compounds instead. Too little heat and you get grassy, underdeveloped flavors. Thermal mapping lets you thread this needle by applying enough heat to fully develop the Maillard reaction without creating harsh compounds.
Flavor development continues after first crack. Rushing through this phase by dropping too early means missing out on flavor. Staying too long means creating bitter compounds. Thermal mapping shows you exactly how long you've been in development and lets you make an informed decision about when to drop.
Last Updated: August 16, 2026
Thermal mapping transforms coffee roasting from an art based on intuition into a discipline based on data. By monitoring bean temperature, environmental temperature, and rate of rise throughout the roast, you eliminate the inconsistency and bitterness that plague traditional roasting methods.
The technical foundation, understanding conduction, convection, and radiation; designing roast profiles; recognizing endothermic and exothermic phases, gives you the knowledge to make informed roasting decisions. The practical tools, roast profile software, data logging, real-time monitoring, give you the power to execute those decisions consistently.
At Iron Spur Coffee, thermal mapping is central to how we deliver complex sweetness and eliminate bitter noise from every bag. We roast to order using precision thermal data, which means your coffee arrives fresh and tasting exactly as intended. Specialty Coffee Association standards define quality roasting as achieving consistent flavor development, and thermal mapping is how we achieve it. When you brew Iron Spur Coffee, you're tasting the result of disciplined thermal control and roasting precision.
Frequently Asked Questions
What is thermal mapping in coffee roasting, and why does it eliminate bitterness?
Thermal mapping monitors both bean temperature and environmental temperature throughout the roast to prevent temperature spikes that cause bitter flavors. By tracking the roast curve and controlling the rate of rise, roasters ensure even heat transfer and consistent flavor development. This precision prevents over-roasting pockets within the batch that create harsh, burnt notes, delivering smooth, complex sweetness instead of bitterness.
How does rate of rise in coffee roasting affect the final flavor?
Rate of rise measures how quickly bean temperature increases during roasting. A controlled rate of rise allows the Maillard reaction and other chemical changes to develop evenly, creating balanced flavor notes. Too fast a rate can lock in sour, underdeveloped flavors; too slow can lead to flat, over-extracted profiles. Thermal mapping software tracks this metric in real time, helping roasters hit the target rate for each bean's unique thermophysical properties.
What's the difference between bean temperature and environmental temperature in a roast?
Bean temperature (BT) is what the coffee itself measures, while environmental temperature (ET) is the air temperature in the roasting drum. ET rises faster than BT because air heats quickly, but beans absorb heat gradually through conduction, convection, and radiation. The gap between BT and ET tells you how efficiently heat is transferring to the beans. Thermal mapping monitors both to catch inconsistencies and adjust airflow or drum speed to maintain a smooth, predictable roast curve.
Can thermal mapping software really guarantee consistent flavor across different roast batches?
Thermal mapping software logs complete roast profiles, allowing roasters to replicate successful roasts with high precision. By recording bean temperature, environmental temperature, development time, and moisture loss data, roasters can identify what produced the desired flavor and repeat it. However, consistency also depends on bean quality, storage conditions, and equipment calibration. Thermal mapping is a powerful tool for roast consistency, but it works best paired with quality-control practices and regular equipment maintenance.
This article was written using GrandRanker